From Mass to Molecule: A Hands‑On Introduction to Proteomics with PANOPLY
A bridge between datasets and proteins for data‑curious people.
1. Why read (and write) this post?
In recent years I have worked as a data analyst mostly related to the usage of Large Language Models (LLMs). As I enter more and more into biological data analysis, I want to diversify from the LLMs. So my curiosity led me to the proteomics field—a domain that, to my surprise, can benefit from LLMs too (but that will not be covered in this blog, if you feel curious about it check: ProteinGPT: Multimodal LLM for Protein Property Prediction and Structure Understanding[1] and Automating Exploratory Proteomics Research via Language Models[2]).
This post is an excuse for me to investigate further into this topic and to be able to explain what I learned to a zero‑bio‑knowledge reader.
2. What is proteomics in plain English?
First of all, let’s talk about the plain basics necessary to understand what proteomics is:
- DNA = molecule that transports the genetic information necessary for the development, functioning, and reproduction of all known organisms. It can be understood as a cookbook that lists every recipe for making proteins.
- Proteins = coded sequence of a DNA fraction that has 3D structure to be able to do a specific function. There’s a huge variety — they transport oxygen, relay signals, destroy invaders…
Proteomics is the art of identifying, counting and studying those proteins so we can figure out what’s really happening inside a cell or organism: Which proteins appear? In what quantities? With what chemical tweaks?
A brief analogy
Imagine a concert:
- The set list (DNA) says which songs should be played.
- Proteomics is sneaking in with a recorder to discover which songs are actually played (sequenced), at what volume (which amount of a protein is going to be sequenced), and with what improvised instruments (modifications in the protein sequence and hence in its structure and function).
Why does it matter?
Proteomics is useful for studying proteins, their interactions, and how they contribute to various biological processes, including health and disease. It helps in understanding cell function, identifying disease biomarkers, and developing new therapies. For instance:
- Precision medicine – pinpoint protein targets for tailored therapies.
- Early diagnosis – a blood‑protein signature can sound the alarm before symptoms.
- Biotechnology – engineer enzymes to produce drugs or biofuels.
3. The usual headaches
Proteomics isn’t just big data; it’s wide, deep, and shape‑shifting data. Each of the ~20 000 human genes can generate tens of proteoforms—variant forms produced by alternative splicing or post‑translational tweaks—so the practical search space easily exceeds one million distinct protein species. Add the lack of universal protein identifiers and the painstaking job of translating raw counts into biological meaning, and you have a perfect storm of complexity.
| Challenge | Why it hurts |
|---|---|
| Huge data volumes | A single mass‑spec run spits out gigabytes. |
| Fragmented pipelines | 10–15 separate tools, each with its own format. |
| Reproducibility | Tiny version shifts break results. |
| Steep learning curve | Bioinformatics + statistics + biology + cloud ops = 🤯 |
4. Meet PANOPLY
PANOPLY[3] is an open‑source, cloud‑based platform for automated and reproducible proteogenomic data analysis. It turns raw proteogenomic reads into interactive, shareable insights with minimal manual plumbing, using state‑of‑the‑art statistical and machine‑learning algorithms to transform multi‑omic data from different samples into biologically meaningful and interpretable results.
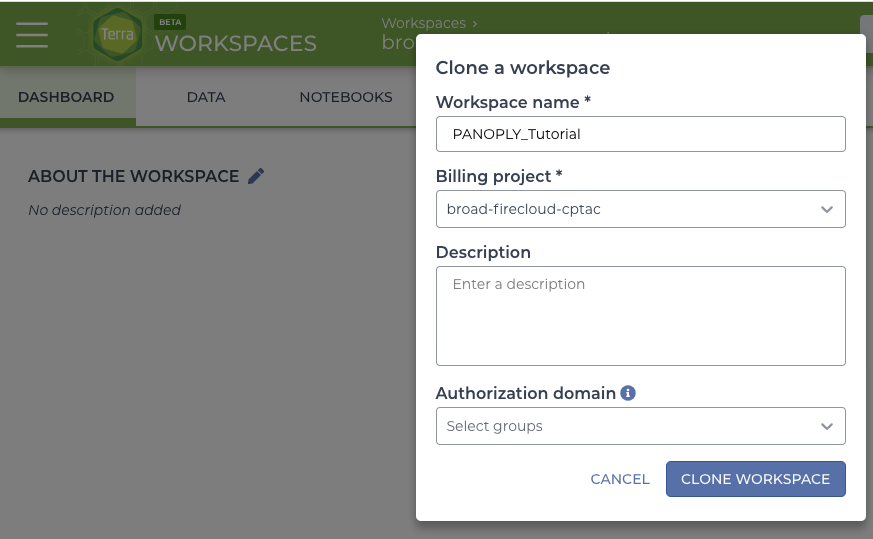
Built on the Terra platform (Google Cloud) and written in Workflow Description Language (WDL), it lets you launch end‑to‑end analyses by cloning a workspace and pressing Run.
What does PANOPLY bundle? (Figure 1A)
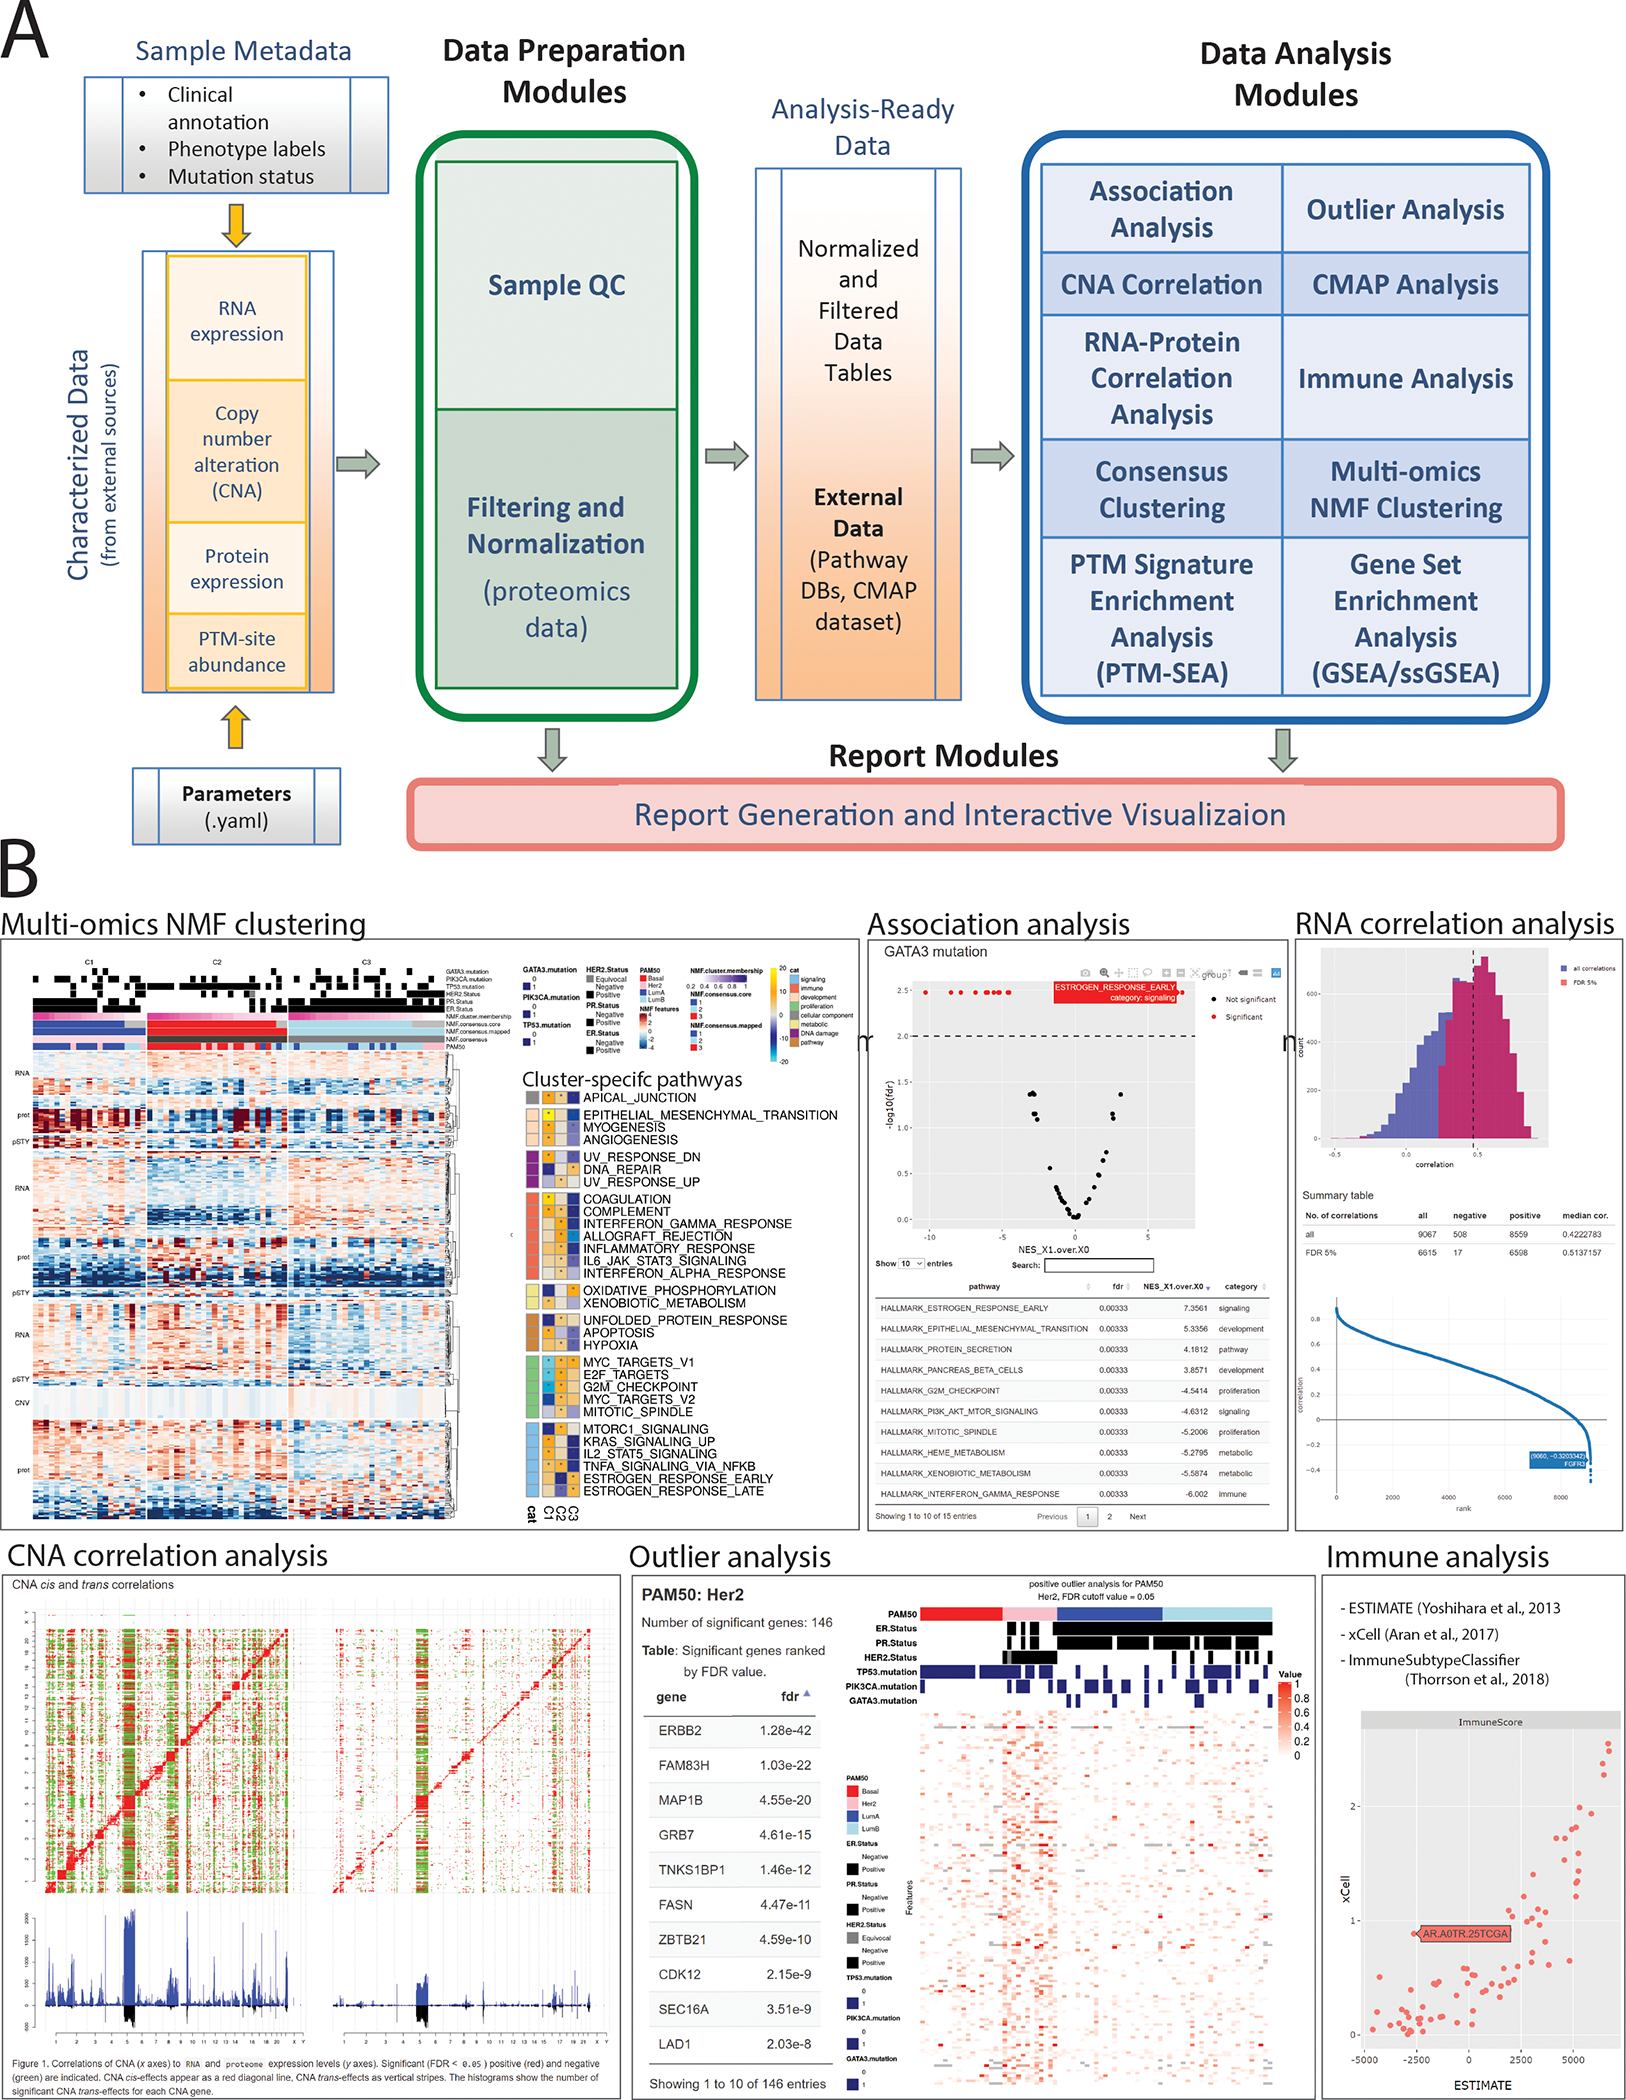
- Data quality & sanity checks
- Sample QC dashboards (profile plots, tumor‑purity scores, sample‑swap detection).
- Feature‑level statistics
- Differential‑abundance tests and association analyses.
- Correlation of RNA expression or copy‑number variation to the proteome.
- Biologically driven scoring
- GSEA and single‑sample GSEA for pathway enrichment.
- PTM‑SEA for post‑translational modification signatures.
- Pattern discovery
- Outlier calling with BlackSheep.
- Consensus clustering and multi‑omic clustering via non‑negative matrix factorization (NMF).
- Therapeutic clues
- Connectivity Map (CMAP) queries to nominate candidate drugs.
- Story‑ready reports
- Each module spits out an interactive HTML summarizing key plots (heatmaps, volcano plots, correlation wheels). (Figure 1B)
- All reports, data and parameters are versioned inside the workspace for reproducibility.
👉 Full module list & docs: see the PANOPLY wiki here.
Ready to dive into the world of proteomic data analysis? Jump to the next section to create a free Terra account and launch your first run!
5. Getting started (important info)
Luckily, PANOPLY v1.0 consists of various components, which I’m going to detail next, along with an extra point that might be critical for some of you who are considering using PANOPLY (you must pay).
- What PANOPLY requires
- To run PANOPLY, you need a Terra account; to create one follow the steps here. A Google account is required to create a Terra account.
- Once you have an account, you need to create a cloud billing account and project. Here you will find step‑by‑step instructions to set up billing, including a free‑credits program for new users to try out Terra with $300 in Google Cloud credits.
- All code and data are accessible online at Github and Terra.
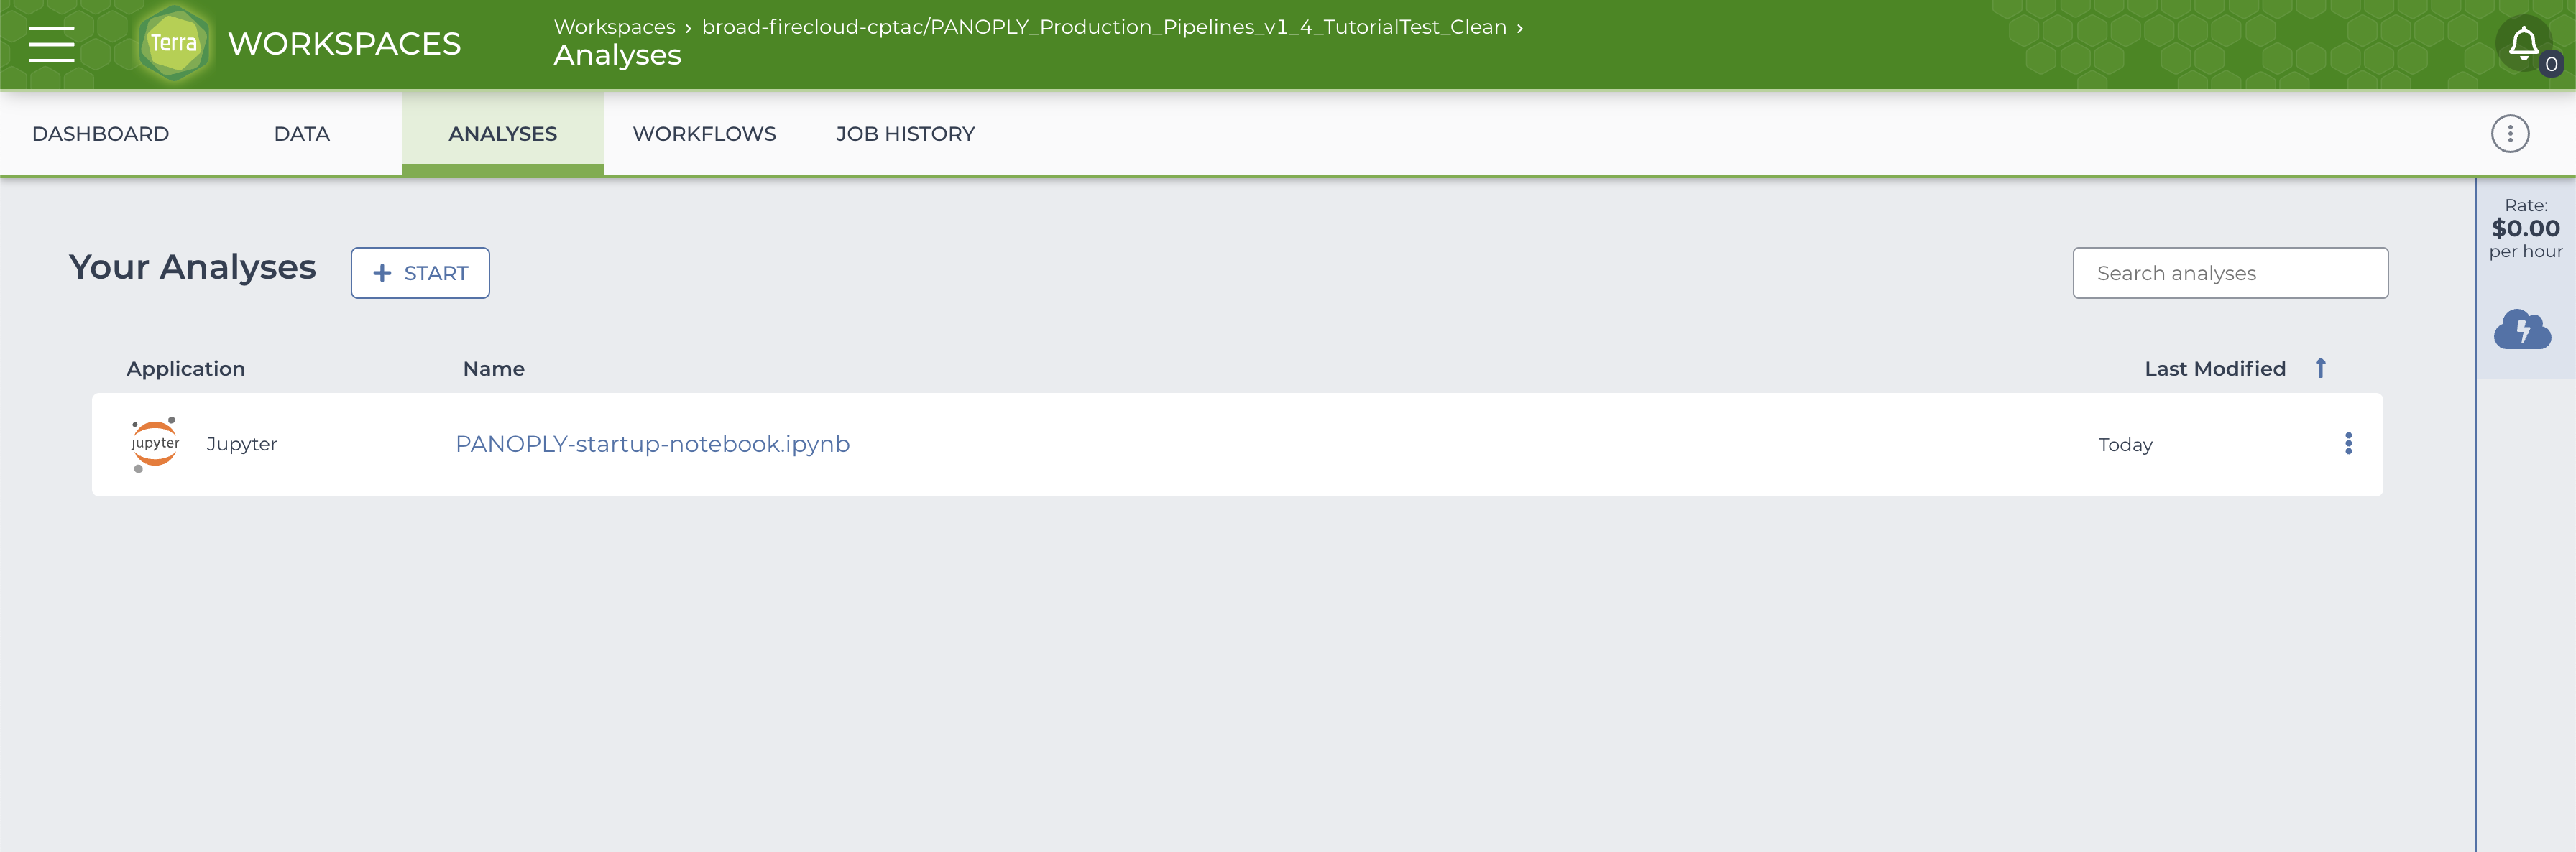
- An interactive Jupyter notebook provides step‑by‑step instructions for uploading data, identifying data types, specifying parameters, and setting up the PANOPLY workspace for analyzing a new dataset.
- A tutorial showing how to use the PANOPLY proteogenomic data‑analysis pipeline for a specific breast‑cancer dataset.
- A workspace with a preconfigured unified workflow to automatically run all analysis tasks on proteomics (global proteome, phosphoproteome, acetylome, ubiquitylome), transcriptome and copy‑number data; and an additional workspace (https://app.terra.bio/#workspaces/broad-firecloud-cptac/PANOPLY_Production_Modules_v1_0) that includes separate methods for each analysis component.
6. Limitations and areas for improvement
While PANOPLY removes many hurdles, it is not a silver bullet. Keep these caveats in mind:
- Pay‑as‑you‑go cost model – Runs only on Terra/Google Cloud; compute, storage, and egress on Google Cloud are billed per use; long workflows or large cohorts can become expensive if you don’t monitor it.
- Steep learning curve for WDL tweaks – Out‑of‑the‑box pipelines run smoothly, but customizing them requires familiarity with WDL and the Cromwell execution engine.
- Cancer‑centric defaults – Many modules and visualizations are optimized for CPTAC cancer datasets; non‑cancer studies may need parameter tuning.
- Documentation gaps – The wiki is expanding but some modules lag behind the code; be ready to read source or ping the Slack.
7. Lightning glossary
| Term | One‑liner |
|---|---|
| WDL | Scripts describing what to run with which inputs. |
| Mass spectrometry (MS) | Ultra‑precise balance that weighs protein fragments. |
| P‑value | How likely it is that your data could have occurred under the null hypothesis |
| Volcano plot | Graph marrying biological effect (fold‑change) and statistics (−log₁₀ p). |
8. Take‑home message
Proteomics used to feel like a cliff for people coming from classical data analytics. Tools like PANOPLY flatten that slope: they automate the grunt work and document every step so we can focus on what matters—interpreting the findings and telling compelling stories with our data.
9.References
1- Ding, N., Qu, S., Xie, L., Li, Y., Liu, Z., Zhang, K., et al. (2024). Automating Exploratory Proteomics Research via Language Models. arXiv preprint arXiv:2411.03743. https://arxiv.org/abs/2411.03743 2- Xiao, Y., Sun, E., Jin, Y., Wang, Q., & Wang, W. (2024). ProteinGPT: Multimodal LLM for Protein Property Prediction and Structure Understanding. arXiv preprint arXiv:2408.11363. https://arxiv.org/abs/2408.11363 3- Mani DR, Maynard M, Kothadia R, Krug K, Christianson KE, Heiman D, Clauser KR, Birger C, Getz G, Carr SA. PANOPLY: a cloud-based platform for automated and reproducible proteogenomic data analysis. Nat Methods. 2021 Jun;18(6):580-582. doi: 10.1038/s41592-021-01176-6. PMID: 34040252; PMCID: PMC8791030. https://pubmed.ncbi.nlm.nih.gov/34040252/
Published: 29/04/2025, not updated as PANOPLY evolves.